
GIVE THE PERFECT GIFT
Erin Mills Town Centre Gift Cards are the perfect choice for your gift giving needs.Purchase gift cards at kiosks near the food court or centre court, at Guest Services, or click below to purchase online.PURCHASE HEREHome
Economy of Southern Asia
Indigo
Loading Inventory...
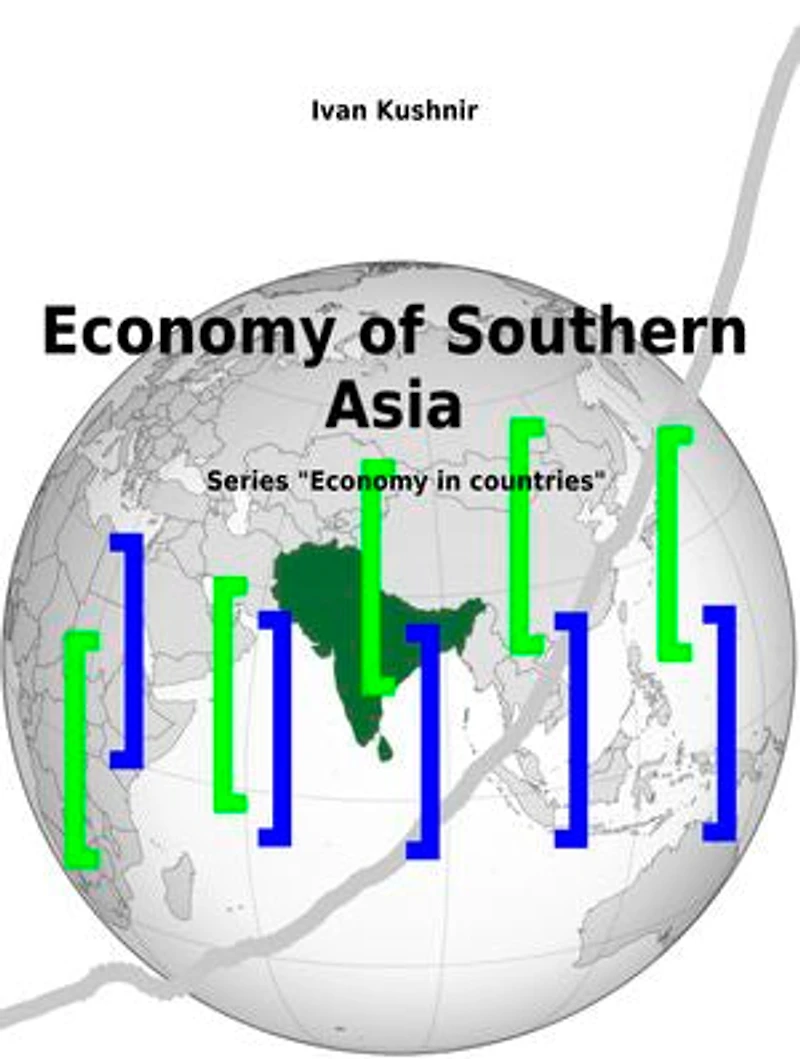
Economy of Southern Asia
Current price: $5.42

Economy of Southern Asia
Current price: $5.42
Loading Inventory...
Size: Kobo eBook
*Product information may vary - to confirm product availability, pricing, shipping and return information please contact Indigo
This book about the economy of Southern Asia from the 1970s to the 2010s. Source data from UN Data.
Size. In the 2010s, the GDP of Southern Asia was equal to $3.3 trillion per year; the value of agriculture was $510.0 billion; the value of industry was $707.6 billion.
Productivity. In the 2010s, the gross domestic product per capita was $1 801.7, the value of agriculture per capita was $280.8, the value of industry per capita was $389.6. Since the productivity is less the average below average, the economy is classified as least developed.
Growth. In the 2010s, the growth of GDP was 5.6%; the growth of agriculture was 3.8%; the growth of industry was 5.9%.
Structure. In the 2010s, the economy of Southern Asia consisted of: services (32.1%), industry (23.2%), agriculture (16.7%), trade (12.6%), transportation (7.9%), and construction (7.5%).
Exports and imports. In the 2010s, the imports were 17.2% higher than the exports, the net imports were equal to 3.5% of the GDP.
Consumption and reproduction. The attitude of reproduction to the consumption is better than the global average, so the share of GDP in the world will increase.
This book about the economy of Southern Asia from the 1970s to the 2010s. Source data from UN Data.
Size. In the 2010s, the GDP of Southern Asia was equal to $3.3 trillion per year; the value of agriculture was $510.0 billion; the value of industry was $707.6 billion.
Productivity. In the 2010s, the gross domestic product per capita was $1 801.7, the value of agriculture per capita was $280.8, the value of industry per capita was $389.6. Since the productivity is less the average below average, the economy is classified as least developed.
Growth. In the 2010s, the growth of GDP was 5.6%; the growth of agriculture was 3.8%; the growth of industry was 5.9%.
Structure. In the 2010s, the economy of Southern Asia consisted of: services (32.1%), industry (23.2%), agriculture (16.7%), trade (12.6%), transportation (7.9%), and construction (7.5%).
Exports and imports. In the 2010s, the imports were 17.2% higher than the exports, the net imports were equal to 3.5% of the GDP.
Consumption and reproduction. The attitude of reproduction to the consumption is better than the global average, so the share of GDP in the world will increase.
You May Also Like






More About Indigo at Erin Mills Town Centre
The largest book retailer in Canada also offers toys, music, home décor, gifts and lifestyle products. What's Inside...Books, Magazines, CD’s and DVD’s, Toys and Gifts, Home Accents, Electronics, Baby’s and Children’s Section, Bath and Body, Kitchen and Bedroom, Stationary Located outside in the exterior plaza.
5015 Glen Erin Dr, Mississauga, ON L5M 0R7, Canada
Find Indigo at Erin Mills Town Centre in Mississauga ON
Visit Indigo at Erin Mills Town Centre in Mississauga ON