

GIVE THE PERFECT GIFT
Erin Mills Town Centre Gift Cards are the perfect choice for your gift giving needs.Purchase gift cards at kiosks near the food court or centre court, at Guest Services, or click below to purchase online.PURCHASE HEREHome
Excel Data Analysis for Busy Professionals: A Step-by-Step Guide to Pivot Tables, Dashboards, Power Query, and Real-World Business Reporting (Beginner to Intermediate)
Indigo
Loading Inventory...
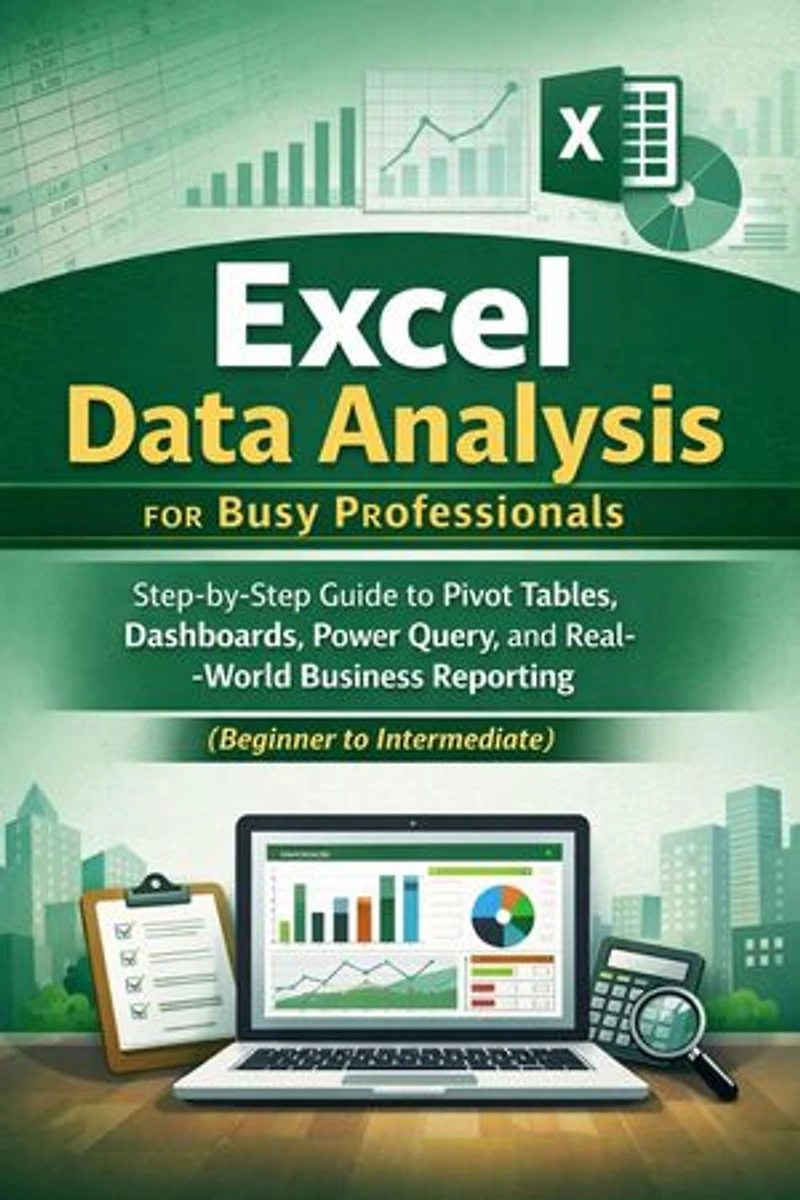
Excel Data Analysis for Busy Professionals: A Step-by-Step Guide to Pivot Tables, Dashboards, Power Query, and Real-World Business Reporting (Beginner to Intermediate)
Current price: $13.99

Excel Data Analysis for Busy Professionals: A Step-by-Step Guide to Pivot Tables, Dashboards, Power Query, and Real-World Business Reporting (Beginner to Intermediate)
Current price: $13.99
Loading Inventory...
Size: Kobo eBook
*Product information may vary - to confirm product availability, pricing, shipping and return information please contact Indigo
Excel Data Analysis for Busy Professionals: A Step-by-Step Guide to Pivot Tables, Dashboards, Power Query, and Real-World Business Reporting (Beginner to Intermediate)
Your reports shouldn't break five minutes before the meeting. I wrote this book for busy professionals who need Excel to behave like a reliable reporting system—not a fragile spreadsheet held together by copy/paste and crossed fingers. I'm Emma Carter, and after years of studying Artificial Intelligence with the great thinkers in the field, I learned a simple truth: good results come from good structure. In these pages, we'll build that structure together—so your analysis is faster, your numbers are cleaner, and your reporting workflow becomes repeatable. You'll learn how to set up modern Excel the right way, clean messy exports without drama, and use formulas that stay readable when your workbook grows. Then we'll level up into PivotTables that don't fall apart, charts that communicate clearly, and practical dashboards that tell a one-page story. Finally, you'll use Power Query to turn "monthly pain" into a refresh button—importing, transforming, combining files, and building a system you can reuse at work. Every chapter follows the same pattern—what you'll build, when to use it, step-by-step instructions, common mistakes, and a checklist—so you always know exactly what to do next.
Inside the book
A job-ready workflow: clean inputs → structured tables → repeatable logic → refreshable outputs
PivotTables built the right way (grouping, filters, sorting, Top/Bottom, and safe field settings)
KPI-ready formulas you'll actually reuse: XLOOKUP, SUMIFS, IF/IFS/SWITCH , and date logic
Practical dashboards that tell a clear story—without flashy, fragile design
Power Query from scratch: import, transform, append/merge, and automate refresh
Real-world practice files and realistic datasets (messy exports included on purpose)
Two portfolio-grade projects: Sales Performance Dashboard + Budget Variance Report
Common mistakes and quick checklists that prevent broken reports under pressure
If you want Excel skills that translate directly into better reporting at work—this is the book that gets you there, fast.
Excel Data Analysis for Busy Professionals: A Step-by-Step Guide to Pivot Tables, Dashboards, Power Query, and Real-World Business Reporting (Beginner to Intermediate)
Your reports shouldn't break five minutes before the meeting. I wrote this book for busy professionals who need Excel to behave like a reliable reporting system—not a fragile spreadsheet held together by copy/paste and crossed fingers. I'm Emma Carter, and after years of studying Artificial Intelligence with the great thinkers in the field, I learned a simple truth: good results come from good structure. In these pages, we'll build that structure together—so your analysis is faster, your numbers are cleaner, and your reporting workflow becomes repeatable. You'll learn how to set up modern Excel the right way, clean messy exports without drama, and use formulas that stay readable when your workbook grows. Then we'll level up into PivotTables that don't fall apart, charts that communicate clearly, and practical dashboards that tell a one-page story. Finally, you'll use Power Query to turn "monthly pain" into a refresh button—importing, transforming, combining files, and building a system you can reuse at work. Every chapter follows the same pattern—what you'll build, when to use it, step-by-step instructions, common mistakes, and a checklist—so you always know exactly what to do next.
Inside the book
A job-ready workflow: clean inputs → structured tables → repeatable logic → refreshable outputs
PivotTables built the right way (grouping, filters, sorting, Top/Bottom, and safe field settings)
KPI-ready formulas you'll actually reuse: XLOOKUP, SUMIFS, IF/IFS/SWITCH , and date logic
Practical dashboards that tell a clear story—without flashy, fragile design
Power Query from scratch: import, transform, append/merge, and automate refresh
Real-world practice files and realistic datasets (messy exports included on purpose)
Two portfolio-grade projects: Sales Performance Dashboard + Budget Variance Report
Common mistakes and quick checklists that prevent broken reports under pressure
If you want Excel skills that translate directly into better reporting at work—this is the book that gets you there, fast.
You May Also Like










More About Indigo at Erin Mills Town Centre
The largest book retailer in Canada also offers toys, music, home décor, gifts and lifestyle products. What's Inside...Books, Magazines, CD’s and DVD’s, Toys and Gifts, Home Accents, Electronics, Baby’s and Children’s Section, Bath and Body, Kitchen and Bedroom, Stationary Located outside in the exterior plaza.
5015 Glen Erin Dr, Mississauga, ON L5M 0R7, Canada
Find Indigo at Erin Mills Town Centre in Mississauga ON
Visit Indigo at Erin Mills Town Centre in Mississauga ON