

GIVE THE PERFECT GIFT
Erin Mills Town Centre Gift Cards are the perfect choice for your gift giving needs.Purchase gift cards at kiosks near the food court or centre court, at Guest Services, or click below to purchase online.PURCHASE HEREHome
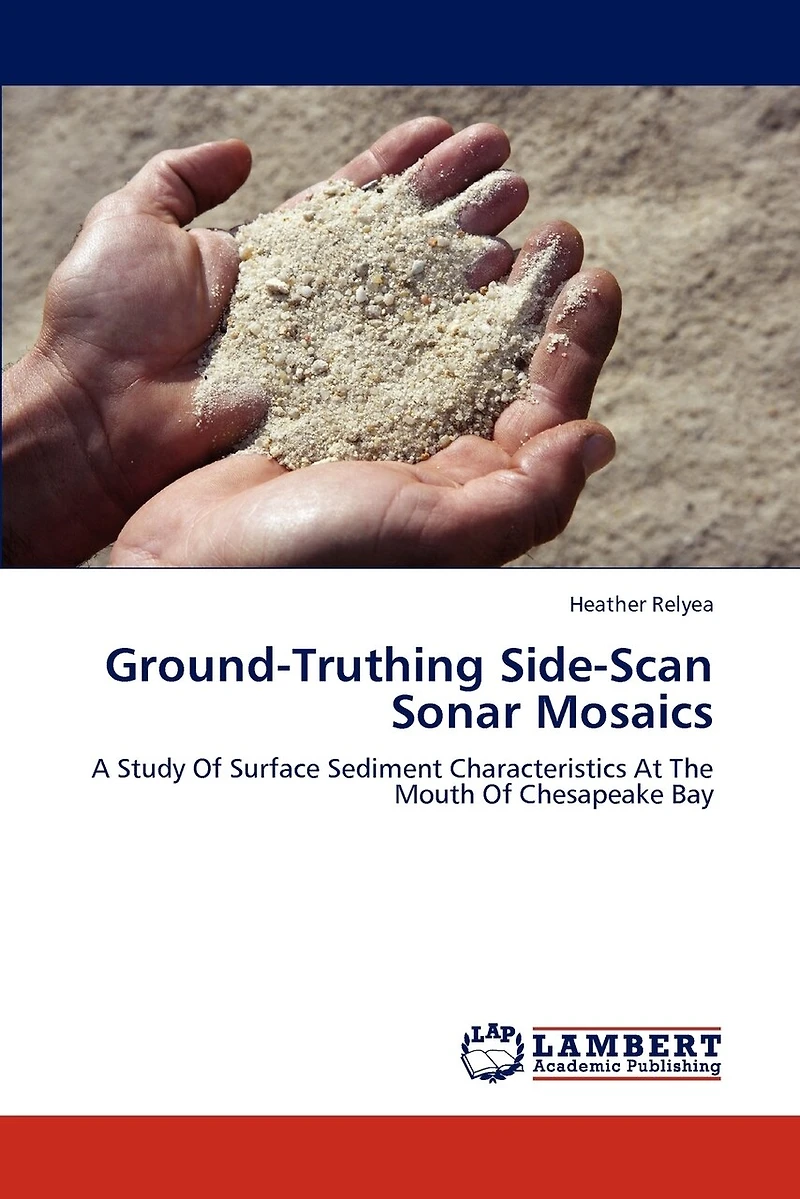
Ground-Truthing Side-Scan Sonar Mosaics
Indigo
Loading Inventory...
Ground-Truthing Side-Scan Sonar Mosaics
Current price: $68.95

Ground-Truthing Side-Scan Sonar Mosaics
Current price: $68.95
Loading Inventory...
Size: Paperback
*Product information may vary - to confirm product availability, pricing, shipping and return information please contact Indigo
This study explored the relationship between bottom sample characteristics and backscatter intensities of high-frequency side scan sonar. Bottom samples collected during the summer of 2009 from an area at the mouth of the Chesapeake Bay in Virginia were compared with side-scan sonar readings taken from the same area by the NOAA hydrographic research ship Thomas Jefferson from 2007-2009. Fifty sediment samples were collected in the study area and analyzed to determine percent carbonate, total organic content, and grain size. These data were then plotted against seven overlapping 455 kHz side-scan sonar mosaics using ArcGIS to visually examine how differences in sediment characteristics relate to differences in the backscatter intensity. Analysis of the data showed that there is a positive correlation between sediment grain size and side-scan backscatter intensity throughout the range of intensities, with a stronger correlation for high intensity areas and coarse grain sizes, but a much weaker correlation in lower intensity areas.
This study explored the relationship between bottom sample characteristics and backscatter intensities of high-frequency side scan sonar. Bottom samples collected during the summer of 2009 from an area at the mouth of the Chesapeake Bay in Virginia were compared with side-scan sonar readings taken from the same area by the NOAA hydrographic research ship Thomas Jefferson from 2007-2009. Fifty sediment samples were collected in the study area and analyzed to determine percent carbonate, total organic content, and grain size. These data were then plotted against seven overlapping 455 kHz side-scan sonar mosaics using ArcGIS to visually examine how differences in sediment characteristics relate to differences in the backscatter intensity. Analysis of the data showed that there is a positive correlation between sediment grain size and side-scan backscatter intensity throughout the range of intensities, with a stronger correlation for high intensity areas and coarse grain sizes, but a much weaker correlation in lower intensity areas.
You May Also Like













More About Indigo at Erin Mills Town Centre
The largest book retailer in Canada also offers toys, music, home décor, gifts and lifestyle products. What's Inside...Books, Magazines, CD’s and DVD’s, Toys and Gifts, Home Accents, Electronics, Baby’s and Children’s Section, Bath and Body, Kitchen and Bedroom, Stationary Located outside in the exterior plaza.
5015 Glen Erin Dr, Mississauga, ON L5M 0R7, Canada
Find Indigo at Erin Mills Town Centre in Mississauga ON
Visit Indigo at Erin Mills Town Centre in Mississauga ON